

Excel At Life
Contents
About▼
Articles▼
Audios▼
Questionnaires▼
Topics
Excel At Life, LLC,
Missouri, USA
Site Last Modified: January 14, 2024


Popular Articles
Crazy-Makers: Dealing with Passive-Aggressive People
Why Are People Mean? Don't Take It Personally!
Struggling to Forgive: An Inability to Grieve
The Secret of Happiness: Let It Find You (But Make the Effort)
20 Steps to Better Self-Esteem
7 Rules and 8 Methods for Responding to Passive-aggressive People
What to Do When Your Jealousy Threatens to Destroy Your Marriage
Guide to How to Set Achieveable Goals
Catastrophe? Or Inconvenience?
Popular Audios
Audio Version of Article: Crazy-Makers: Passive-Aggressive People
Audio Version of Article: Why Are People Mean? Don't Take It Personally!
Analyzing Your Moods, Symptoms, and Events with Excel At Life's Mood Logby Monica A. Frank, Ph.D. |
|---|
“What triggers my stress?”
“When am I not as depressed?”
“Do certain foods make my pain worse?”
“Are my headaches associated with certain places or people?”
“Are my moods worse during my menstrual cycle?”
“Is my treatment effective?”
“Is my athletic performance enhanced by certain moods?”
All these questions and more can be answered by the Mood Log feature in Excel At Life's CBT Tools for Healthy Living app. It has been updated to include a variety of new tools. Although these new features increase the potential for your desired results, they also bring additional complexity. Sometimes it can be difficult to know how to use the app to best suit your situation. A previous article I wrote, I'm Depressed. I'm Overwhelmed. Where Do I Start? addresses simple ways to begin using CBT.
To help you use the app more effectively I want to give you tips on using a new feature that I'm excited to provide as it can be so useful in many different ways. The Mood Log feature of the app not only gives you a place to record your daily moods but it will provide an analysis of how different activities or events can impact your moods. Not only that, but as the mood logs are fully customizable you can use the logs to track not only moods but symptoms and events to determine what are the contributors to your moods and symptoms. The following provides examples of how you can use the mood logs.
Recall vs. Daily Mood Log
A well-known research fact is that recall of symptoms, mood, pain and associated events is poor and biased. We usually think our recall is accurate but when compared to a diary or reports from others we are often mistaken. And worse, our recall is influenced by current mood (Schraedley et al., 2002).
For instance, in my clinical practice I gave clients a form to complete prior to every session which included mood ratings. Sometimes clients would say “Nothing ever seems to help. I never feel better.” If I disagreed, they argued, “But that's the way it feels!” I explained to them that even though it feels that way at the moment it is not true. Then, I would take out their prior mood ratings and show them how much better they felt in the past and what was associated with their moods such as “You were more socially involved last month and your mood was much better.”
Being able to see for themselves how their mood varied helped my clients to be more hopeful and to continue making positive changes. The more you understand about what triggers your moods and symptoms, the more potential control you can have. The Mood Log can provide you (and your therapist) with valuable information.
The Mood Log lets you use facts to fill in the blanks rather than making them up. We often believe something when we have no evidence because it was something we were told or it happened once before. For example, many people believe “comfort food” helps them to feel better. However, research (Wagner, H., et al., 2014) shows that the concept of comfort food is a myth—that moods are not different after eating comfort foods than after eating other enjoyable foods or not eating at all.
Why is Excel At Life's Mood Log Better than Simply Recording Moods?
Many mood trackers are available. But that is all they do. You can see how your moods fluctuate but unless you are good at finding patterns (without recall bias) it is difficult to know the triggers or associated events.
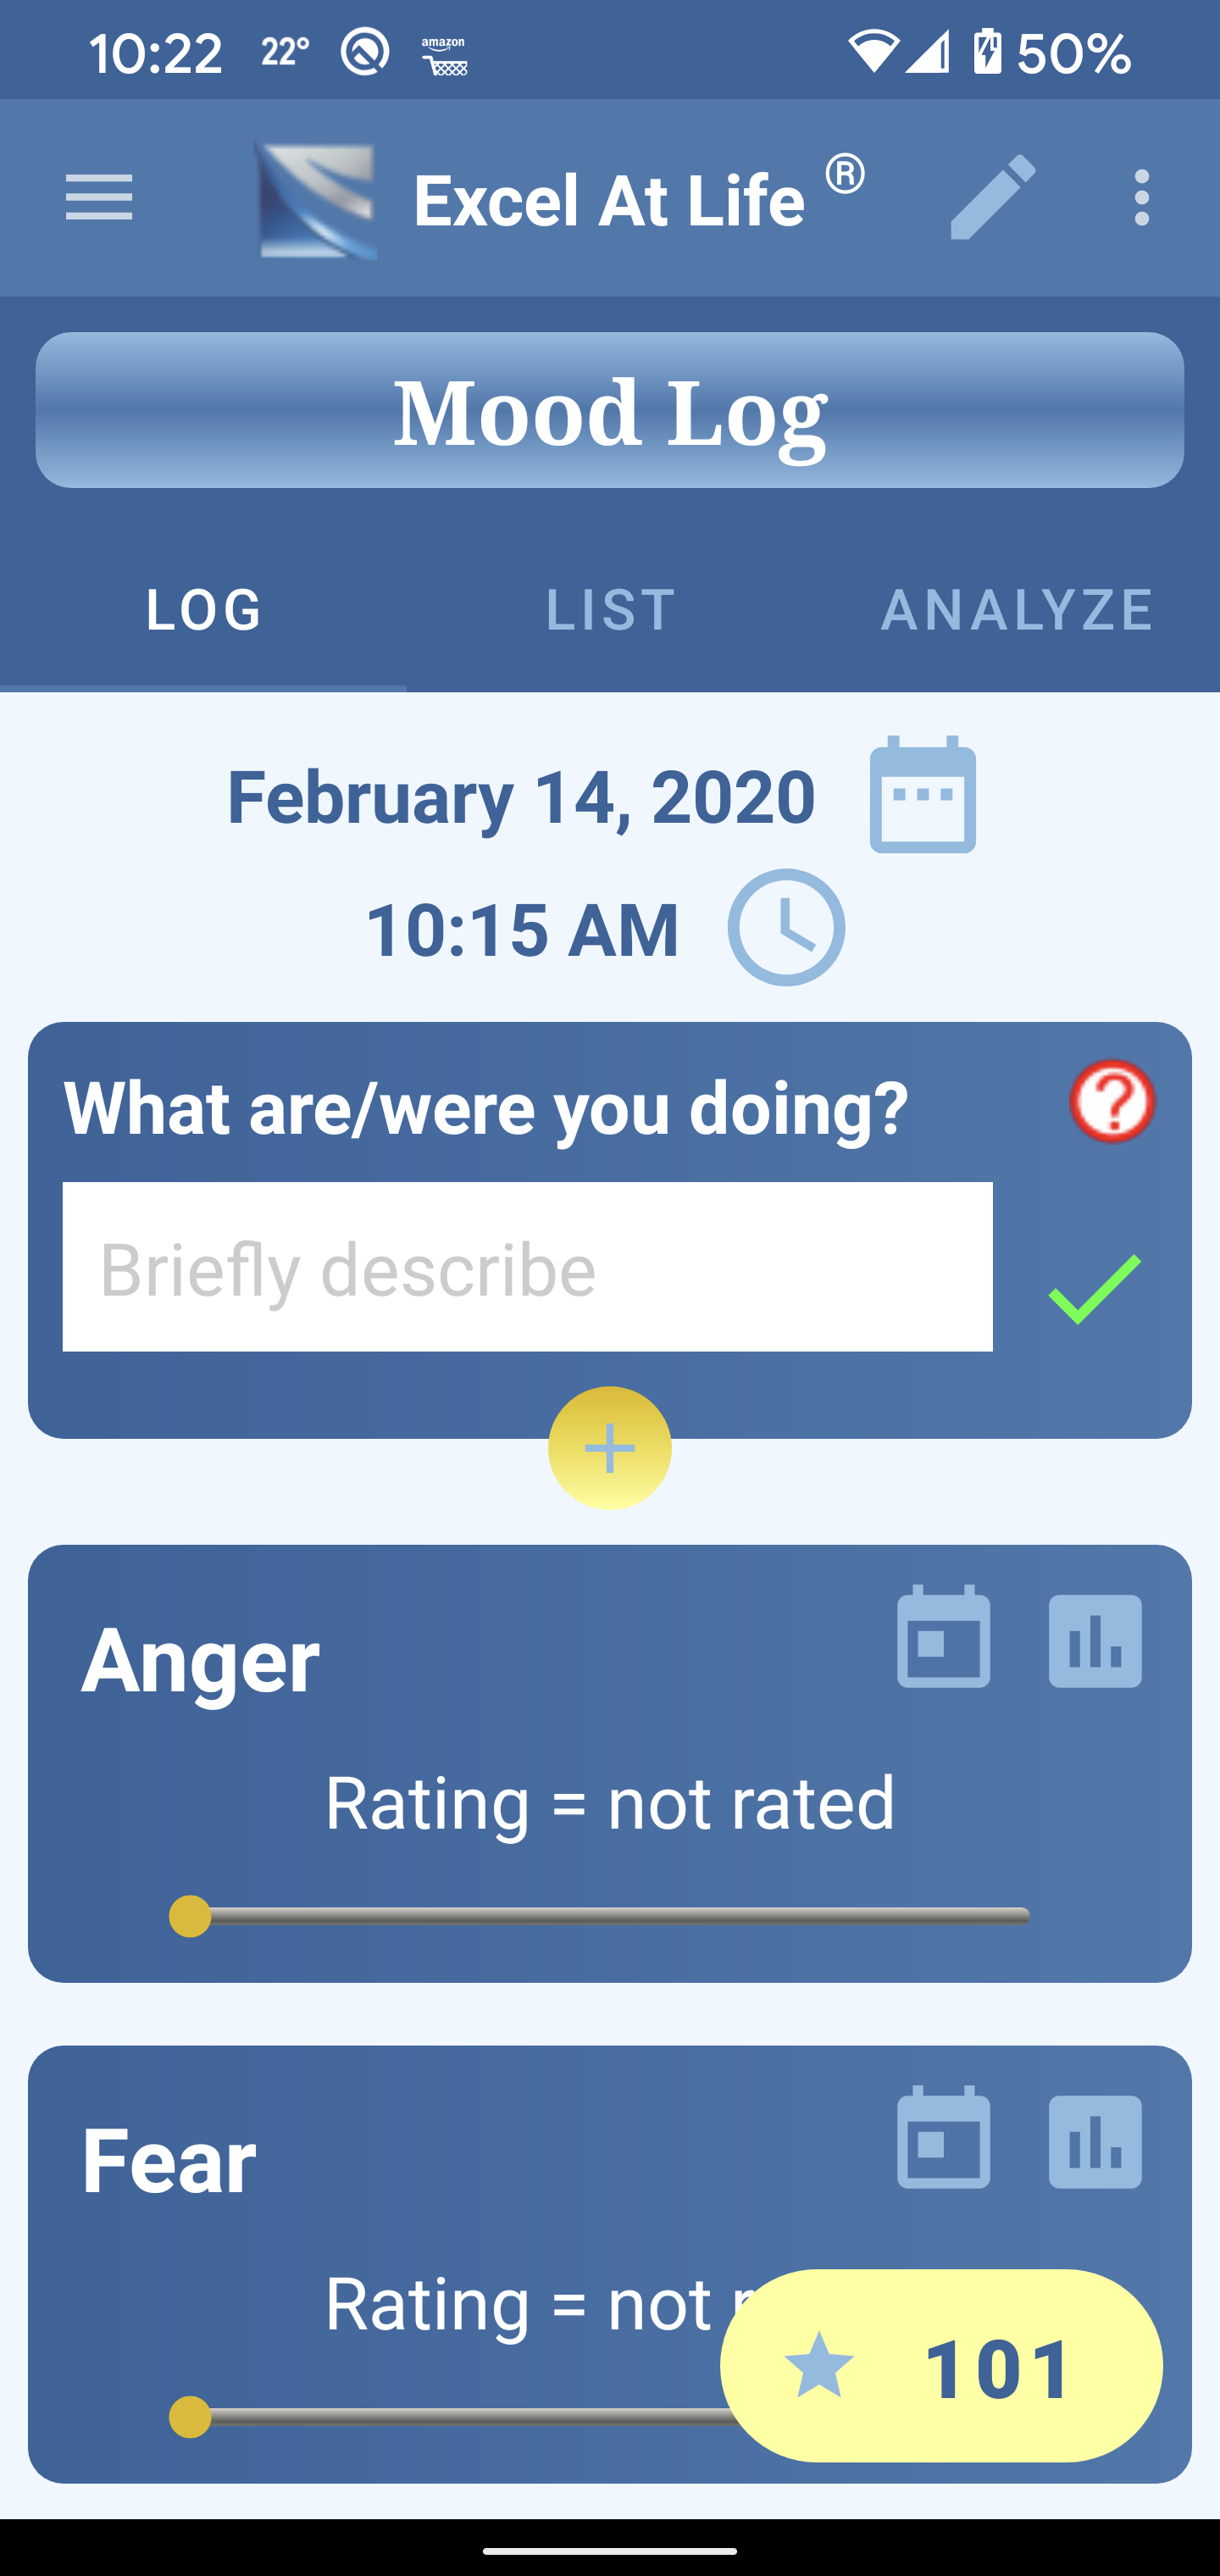
The Mood Log allows you to record your moods in 15 minute intervals throughout the day. Moods can fluctuate considerably with different activities so a simple once a day mood tracker is not enough to help you understand the changes in your mood.
The Mood Log lets you rate moods or symptoms (or anything that occurs frequently and can be assessed on a 10 point scale). In addition, you can select actions, activities, or events that were occurring at the same time. The analysis feature of the app will tell you which moods occurred with these actions and the average rating for each mood. Don't worry—I know this is pretty abstract right now but I will give you plenty of examples as you read on. As the analysis feature is customizable, it is only limited by your imagination.
The other feature that is unique about the Mood Log is that it is fully customizable:
1) Choose moods or symptoms to track. Although the Mood Log provides a list of basic moods, you can also add any moods you want to track. But you're not limited to moods. You can track symptoms such as headaches, back pain, nausea, etc.
2) Create your own high/low labels. The moods or symptoms or assessed on a 10 point scale from low to high. However, if some other label makes more sense for what you are trying to track, you can change the label. For example, if you want to track hunger you could label it “starving” to “stuffed.”
3) Choose actions, activities, or events. The Mood Log comes with a list of actions from which you can select such as working, eating, exercising, attending class, etc. However, you can include your own. If you suspect that certain events such as socializing with a certain friend or eating specific foods are contributing to a negative mood you could track those events.
An Important Note to Most Effectively Use the Analysis Feature
The analysis can only be as accurate as the data. For the most effective use of this feature, the following is necessary:
1) Lots of ratings. When using averages, the accuracy increases with the more data that is available. For instance, if you want to know the average household income in your community, asking two people for their information can lead to a wildly different outcome than asking thirty people. Generally, having thirty or more ratings will provide you with more accurate information.
2) Consistent ratings. The closer you are to keeping daily ratings the more accurate your analysis will be. For instance, if you tend to only rate yourself when you are feeling bad you might not be able to analyze the effects of different situations on a negative mood because you don't have a comparison.
3) Define the ratings clearly. Be sure you have clearly specified what your ratings mean. For instance, if you are rating your pain level, have a good understanding what the difference is between a 5 or an 8 so that you can be uniform in your ratings. These ratings don't have to conform to anyone else's rating but need to make sense for you.
Determine What Impacts Your Moods
When you determine that certain actions or events impact your moods, you are then able to do something to change the situation. As a psychologist, I often viewed my role as a detective—the more that I could observe patterns in my clients moods, symptoms, and behavior, the more I was able to help them pursue changes that were more likely to lead to desired outcomes.
Examples:
1) What triggers my stress?
The triggers for stress can be quite different for different people. In fact, what is stressful for one person may be pleasurable for another. A classic example is that an extrovert may enjoy being the center of attention whereas an introvert may find the same situation very stressful.
The Mood Log helps you to identify situations that may trigger your stress. To use the Mood Log for this purpose, make a list of situations that might be triggering your stress and add them to the list of activities in the Mood Log. Add “stress” to your list of moods. Recording your stress level over time and your activities or actions will allow you to see in the “Analyze” section of the Mood Log what your average level of stress is for each activity.
2) “When am I not as depressed?”
People with depression typically view their life through the lens of the depression. As a result, when they are depressed they have little memory of happy times or enjoyable events. Such a distortion tends to make the depression worse as it increases discouragement and hopelessness.
Treatment has often been focused on getting people with depression to engage in enjoyable activities because research has shown that it helps with depression. The difficulty with this method is those with depression typically anticipate that activities will not be pleasurable (Sherdell, et al., 2012). “Nothing is ever enjoyable!”
Yet, keeping daily logs has often shown that this belief is negatively biased. When someone with depression engages in a normally enjoyable activity and is asked during the activity if it is enjoyable, they often report that it is.
Recording in the Mood Log consistently can help you identify situations that are enjoyable so you can engage in those activities more. As you engage in activities list them in the Mood Log and rate how pleasurable they are. The closer you rate the activity to the time you are actually engaged will allow a more accurate analysis. This method often allows those with depression to see that their mood does fluctuate with different activities and they do experience enjoyment.
Analyze the Contributors to Physical Symptoms
It has been known for a long time that reporting of physical symptoms is affected by what is known as a “recall bias” (Howren & Suls, 2011). For instance, someone's memory of pain is impacted by their current pain level. In other words, if your current pain is severe you are more likely to report that the pain was severe in the past. As a result, people's reporting of past pain is frequently inaccurate (Eich et al., 1985).
The Mood Log can help you see associations between your symptoms and certain situations. By keeping a daily log you are less likely to be influenced by recall bias.
Examples:
1) “Are my headaches associated with certain places or people?”
The Mood Log can help you determine if places or people may be contributing to your headaches. You can customize the actions list in the Mood Log with as many events, places, or people that you wish. Also, you can customize the mood section to include “headaches.” Then when you have a headache, select from the action list the event or the people present and rate your headache. The “Analyze” section will provide your average rating for the selected events or people.
Another tip is to rate when you don't have a headache to see if not having a headache may be associated with certain actions, events, or people. By doing so you can increase actions or behaviors that improve your pain.
2) “Do certain foods make my pain worse?”
Many people find that certain foods or additives can increase physical symptoms such as pain. You can use the Mood Log to track problem foods. To do so, add “pain” to your mood list and add potential problem foods to the action list. Over time, you will be able to discern a pattern by using the “Analyze” section and seeing the average ratings of your pain with certain foods/additives.
Track Events
Often there are certain events that you might like to track to see how they correlate with your moods. The Mood Log can easily be customized to be used in that way.
Examples:
1) “Are my moods worse during my period?”
Although many women believe their moods are worse at certain times of their menstrual cycle, this belief may or may not be accurate. By keeping the Mood Log consistently you will be able to see how your moods may vary. The best way to do this is to create a system in the action list for monitoring your cycle. There are different ways this could be done. For instance, you could add “not menstruating”, “premenstrual”, and “menstruating” to the action list or you could measure it by each week.
2) “Is my athletic performance enhanced by certain moods?”
Athletic performance can be affected by moods. How moods affect performance can vary for each individual, however. Some people may have improved performance with a high degree of relaxation whereas others might do better with a high level of anger. The Mood Log allows you to see what mood state might work best for your performance. To analyze performance first add the activity to the action list. Then rate your moods whenever you engage in that activity. The analyze feature will show your averages for each mood you rate.
Treatment
The Mood Log has unlimited potential as an aid to therapy.
Examples:
1) “Is my treatment effective?”
The Mood Log can be useful for measuring treatment methods for depression, anxiety or even physical problems. Your therapist can help you to determine ways to do this for the different methods in your therapy.
For example, if you have an anxiety disorder and are learning to use relaxation methods you can put “relaxation” in your action list and record your anxiety level. Or, if you are switching antidepressants, you can put the different medications in your action list and add them to your mood ratings.
This Mood Log allows you to go back to prior entries and add actions. So, for instance, if you have been recording moods but didn't have the medication added to your ratings you can add it to prior entries.
2) “Are my treatment exposures reducing my anxiety?”
If you are doing exposures in your therapy you can use the “Analyze” feature to see how your average anxiety level changes over time. Add “anxiety” to the mood log and add the exposure to the action list. The “Analyze” feature allows you to see how your anxiety level is different from the present to the past week, month or year.
In addition, the 15 minute option of recording mood levels can be useful to see how your anxiety level reduces during an exposure session. To view, tap the “Daily” for anxiety.
Using the Graph Feature
To make the Mood Log even more effective, the graph feature allows you to view different moods and actions together. This allows you to analyze patterns based on multiple actions. For instance, you can see how your mood varies when you are doing something alone or with someone. To examine these types of patterns you need to select more than one action when you record your moods. Example: select "walking" when you are alone or select "walking" and "visiting a friend" when you are with someone.
Remember, you can customize this list so that you could put specific friend's names in the list so as to compare "walking" with one friend and "walking" with another. The more you customize your mood log, the more effective it can be with helping you to understand your moods.
In addition, since you can customize the mood list to include symptoms you can examine symptoms on the graph based on certain actions. For instance, if you record your pain levels and select from the action list, you can see how your pain varies with different actions or combinations of actions. Perhaps, "walking" alone is associated with an increase in pain while "walking" with a "friend" is associated with a decrease in pain. This would tell you that having a distraction can reduce your experience of pain.
How this mood and symptom log can be used to understand patterns is limited only by your inventiveness when customizing. The more you record in it the more it can help you understand yourself so as to make effective changes in your life.
References
Eich, E., Reeves, J. L., Jaeger, B., & Graff-Radford, S. B. (1985). Memory for pain: relation between past and present pain intensity. Pain, 23(4), 375-380.
Howren, M. B., & Suls, J. (2011). The symptom perception hypothesis revised: Depression and anxiety play different roles in concurrent and retrospective physical symptom reporting. Journal of Personality and Social Psychology, 100(1), 182–195. https://doi.org/10.1037/a0021715
Sherdell, L., Waugh, C. E., & Gotlib, I. H. (2012). Anticipatory pleasure predicts motivation for reward in major depression. Journal of abnormal psychology, 121(1), 51–60. https://doi:10.1037/a0024945
Schraedley, P., Turner, R., & Gotlib, I. (2002). Stability of Retrospective Reports in Depression: Traumatic Events, Past Depressive Episodes, and Parental Psychopathology. Journal of Health and Social Behavior, 43(3), 307-316.
Wagner, H. S., Ahlstrom, B., Redden, J. P., Vickers, Z., & Mann, T. (2014). The myth of comfort food. Health Psychology, 33(12), 1552–1557. https://doi.org/10.1037/hea0000068
Permission to reprint this article for non-commercial use is granted if it includes this entire copyright and an active link.